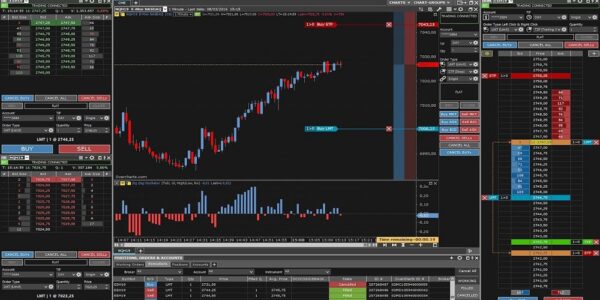
Overcharts is fast and intuitive trading platform used by professional traders to analyze markets and execute orders. Overcharts mission is to provide traders the best trading experience and chart analysis, all in a single trading platform.

Technical Analysis Trading Platform
Overcharts Platform Fees
| Monthly | Quarterly | Biannually | Annually |
| $39.95 | $110.85 | $203.70 | $359.40 |
Traders who want to use Overcharts must signup directly on the Overcharts website. We do not facilitate payment services to use their trading platform.
| Data Feed | Monthly |
| GAIN | $10 |
| Rithmic | $25 |
These are pass through fees from the data feed providers to connect their API to Overcharts. These fees are debited from your trading account and made payable to the data feed providers.
Intraday Margins
Commissions
Deposit Minimum
Overcharts Platform Demo
Demo trading is a powerful tool to help develop trading skills,
test different strategies, and fine-tune trading systems.
- Learn how to use the platform
- Practice trading with no risk
- Access the global markets
- Real-time market data
Sign Up Today
Overcharts Platform Features
User friendly trading platform that is simple and intuitive along with the ability to save settings on the cloud.
Volume Profile
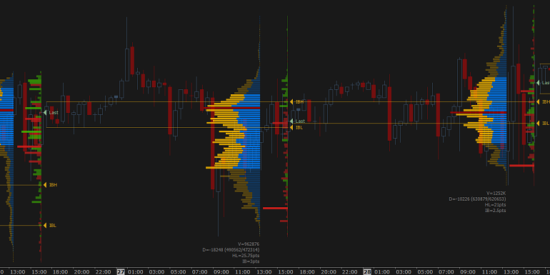
The tick/volume analysis includes a package of indicators and tools that are essential to understand market movements in advance. Volume Profile shows the volume traded in the various price levels, highlighting if there are more buyers or sellers.
TPO Profile
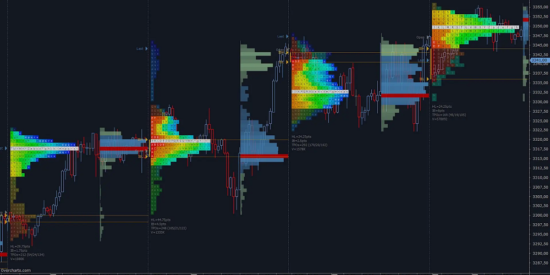
TPO Profile is similar to volume profile. Time-Price Opportunity (TPO) shows the price distribution during the specified time and highlights at which levels the price has spend the most time. TPO Profile is generally used in conjunction with volume profile to better identify areas of support and resistance.
Volume Ladder
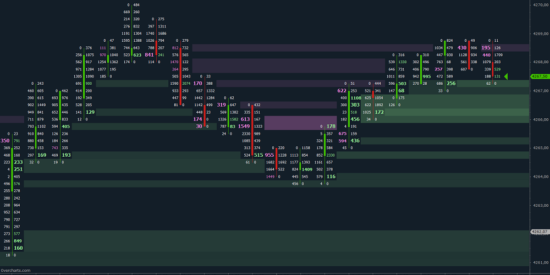
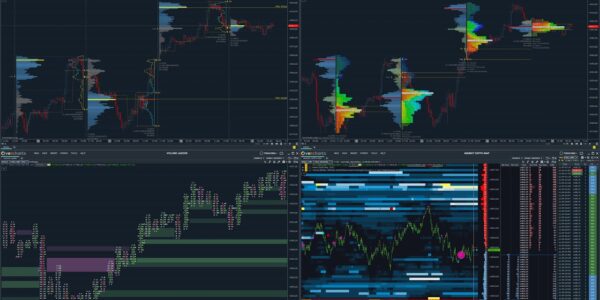
Volume Ladder is one of the most important indicators of order flow analysis. It displays volume, bid/ask, delta and other volume statistics all together inside of each bar. This allows traders to trade faster and more accurately.
Market Depth Map
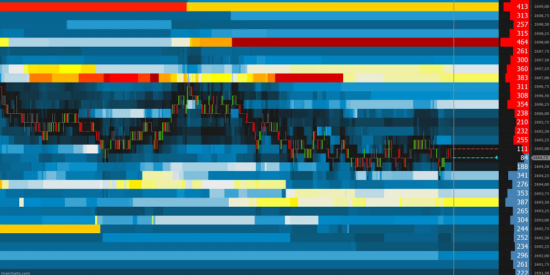
The Market Depth Map helps traders identify potential levels of support and resistance by analyzing the volumes of limit order book (DOM). Each price level takes on a different color depending on the volume of corresponding DOM level. The higher the volume, the greater the intensity of color and, the higher probability of identifying a support or resistance.
DOM & Chart Trading
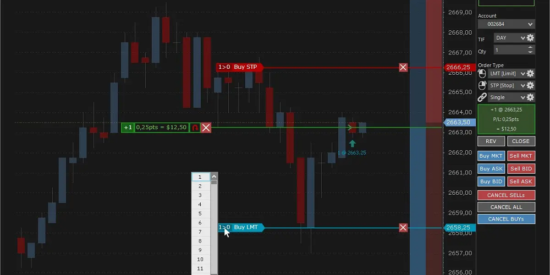
Chart & DOM uses the same method to place, edit, or cancel orders. Overcharts offers a wide range of order types and linked orders.
Time & Sales
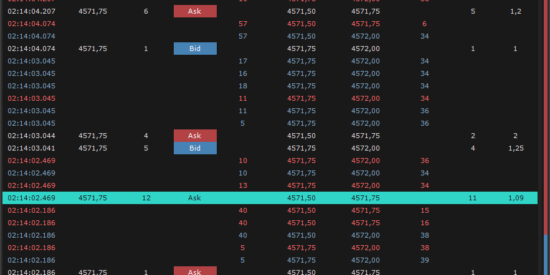
Time & Sales shows in detail Tick-by-Tick data flow in real time of the single instrument. All filled trades are displayed by reporting the price, size, execution time, and whether the trade was filled at Bid or Ask.
With multiple trading platforms and data feed options, traders can access the world of futures trading with competitive intraday margins and low commissions.
