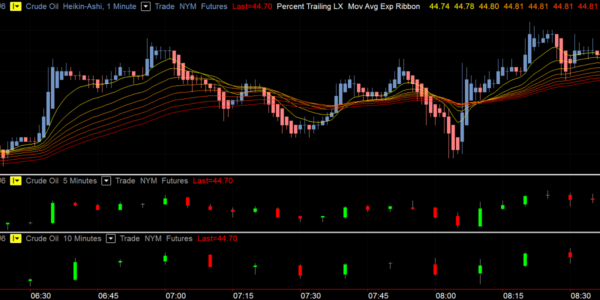
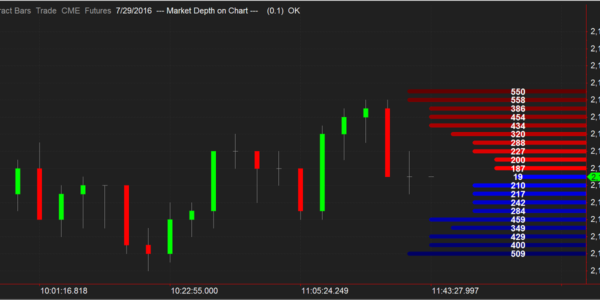
MultiCharts is a complete trading platform for active futures traders. Equipped with high-definition charting, built-in indicators and strategies, one-click trading from chart and DOM, high-precision backtesting, brute-force and genetic optimization, automated execution and support for EasyLangauge scripts are all key tools available on the platform.

Advanced Market Analysis Features
MultiCharts Platform Fees
| Monthly | Quarterly | Annually | Lifetime |
| $97 | $267 | $792 | $1,497 |
Traders who want to use MultiCharts must signup directly on the MultiCharts website. We do not facilitate payment services to use their trading platform.
| Data Feed | Monthly |
| CQG | $10 |
| GAIN | $10 |
| Rithmic | $25 |
These are pass through fees from the data feed providers to connect their API to MultiCharts. These fees are debited from your trading account and made payable to the data feed providers.
Intraday Margins
Commissions
Deposit Minimum
MultiCharts Platform Demo
Demo trading is a powerful tool to help develop trading skills,
test different strategies, and fine-tune trading systems.
- Learn how to use the platform
- Practice trading with no risk
- Access the global markets
- Real-time market data
Sign Up Today
MultiCharts Platform Features
MultiCharts’ advantage is based on building robust trading strategies, accurate market data with minimal delivery time, order execution within milliseconds, and lower-than-average transaction fees. With tools such as high-definition charting, technical indicators, backtesting, and strategy execution, everything you need is at your fingertips.
Chart Trading
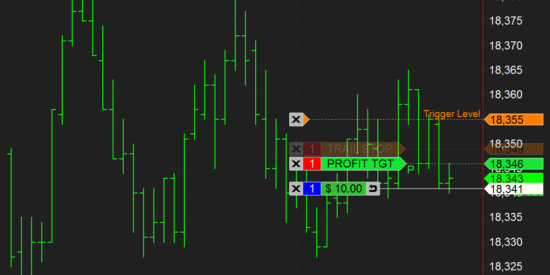
Drop an order on the chart and adjust it if needed. Move orders around to march other price levels on the chart, such as breakout or support levels, or drag more orders. Traders can also drag-and-drop automation strategies to further exchange their trading comfort and speed.
Depth of Market (DOM)
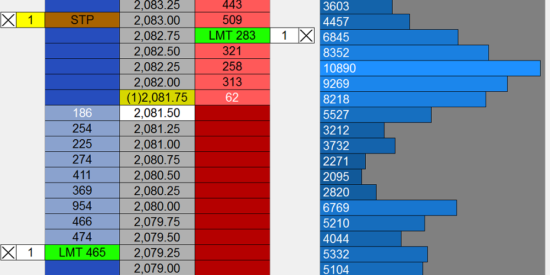
The DOM is an industry-standard tool that lets traders see market depth and trade with one click. In MultiCharts, traders can see ten price levels each way and apply entry and exit automation directly in the DOM window.
Automation of Entries and Exits
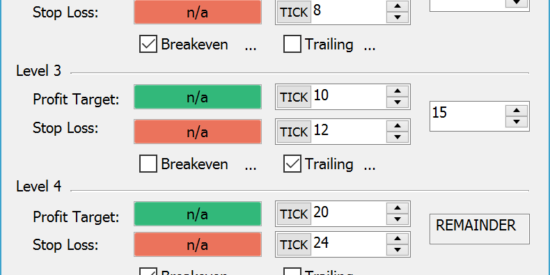
Sometimes thee is no time to place entry or exit OCO orders by hand, so MultiCharts built automation strategies that traders can simply drag-and-drop onto charts. Drop them onto any point on the chart, or attach them to a particular order or position.
Volume Profile
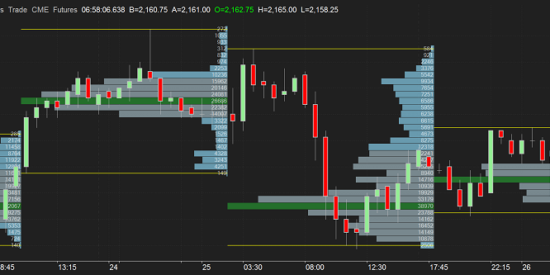
Volume Profile is a vital tool that shows the most traded prices for a particular time period. It plots volume as a histogram on the price bar.
Volume Delta
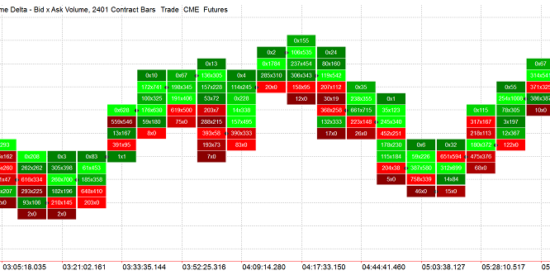
Volume Delta helps traders keep track of trades that were completed on ask or bid prices in real-time. It plots a series of boxes with volume displayed inside them.
Cumulative Delta
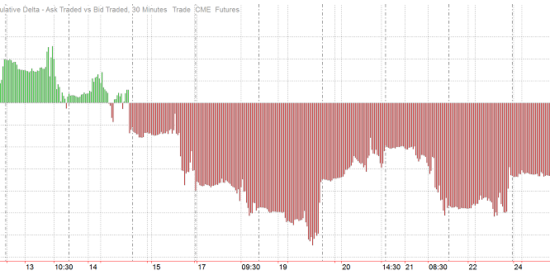
Knowing if there are more buyers or sellers at a particular price can be an important indication of where the market is going. Cumulative delta plots the difference between asks and bids.
Drawing Tools
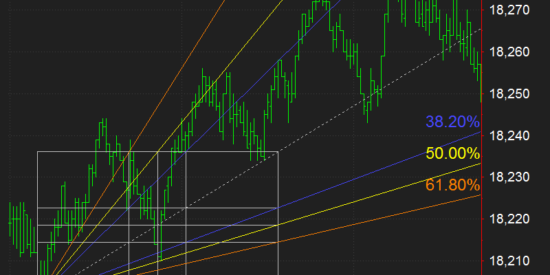
A broad range of intelligent drawing tools are available. These tools allow traders to focus on trends, support and resistance, gaps, pivots, triangles, and other price patterns.
Strategy Development
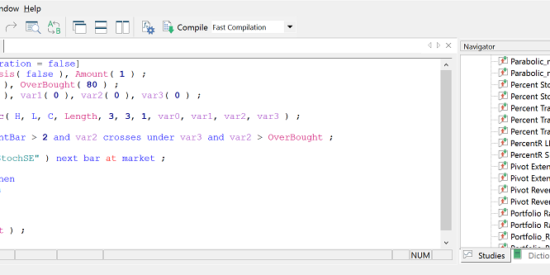
MultiCharts offers PowerLangauge that is an evolution of EasyLangauge. It allows the creation of simple strategies without requiring any special education. Simply looking at the built-in scripts is enough to understand the logic and being programming.
With multiple trading platforms and data feed options, traders can access the world of futures trading with competitive intraday margins and low commissions.
