MotiveWave is a feature-rich, user-friendly, and highly customizable trading software with beautiful charts. MotiveWave also have the most advanced Elliott Wave software available. MotiveWave is available in 6 different editions to meet your charting and trading needs, and we also offer multiple purchasing options to fit any budget.

Trading Platform to Fit Any Trader
MotiveWave Platform Fees
| Version | Monthly | Lifetime |
| Standard | $24 | $245 |
| Order Flow | $49 | $595 |
| Elliott Wave Lite | $89 | $1,395 |
| Pro | $99 | $1,495 |
| Ultimate | $159 | $2,295 |
Traders who want to use the MotiveWave trading platform must signup directly on the MotiveWave website. We do not facilitate payment services to use their trading platform.
| Provider | Monthly |
| CQG | $10 |
| GAIN | $10 |
| Rithmic | $25 |
These are pass through fees from the data feed providers to connect their API to MotiveWave. These fees are debited from your trading account and made payable to the data feed providers.
Intraday Margins
Commissions
Deposit Minimum
MotiveWave Platform Demo
Demo trading is a powerful tool to help develop trading skills,
test different strategies, and fine-tune trading systems.
- Learn how to use the platform
- Practice trading with no risk
- Access the global markets
- Real-time market data
Sign Up Today
MotiveWave Platform Features
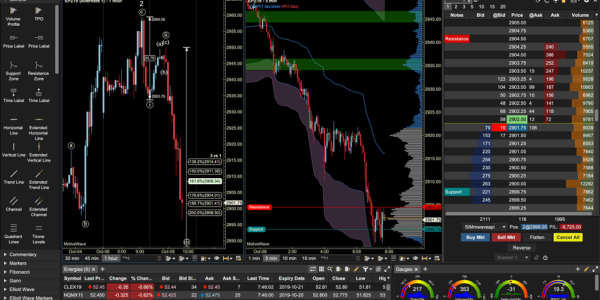
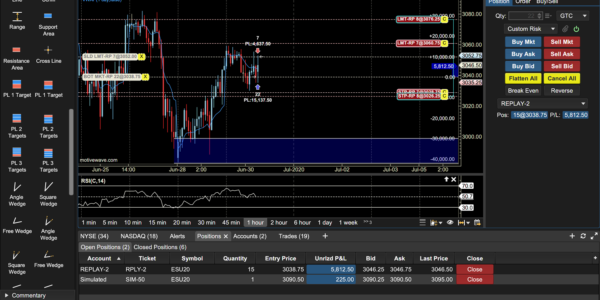
MotiveWave is an incredibly feature-rich trading platform that supports Windows, macOS and Linux operating systems.
Mobile Trading App
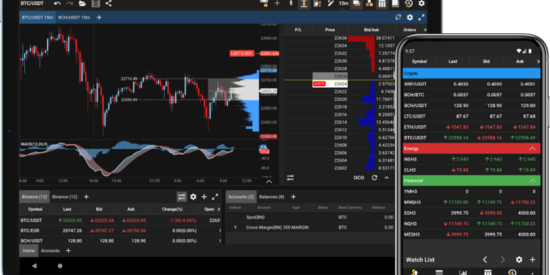
The MotiveWave Mobile charting and trading application complements the desktop application allowing traders to easily trade and monitor the futures markets from anywhere.
Chart Trading
Place orders directly on the charts from the price axis with a single mouse click. Limit Buy/Sell orders can be places at a specific price by clicking above or below the current price. Use the Trade Panel for more complex order management.
Depth of Market
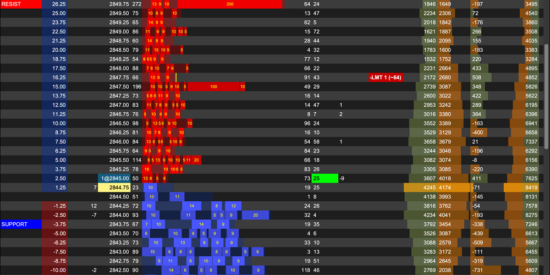
The Depth of Market (DOM) shows the number of resting (limit) buy and sell orders. The DOM can also be used to display other columns such as trades recently executed on the bid or ask, orders being added or pulled and volume traded at each price level.
Volume Imprint
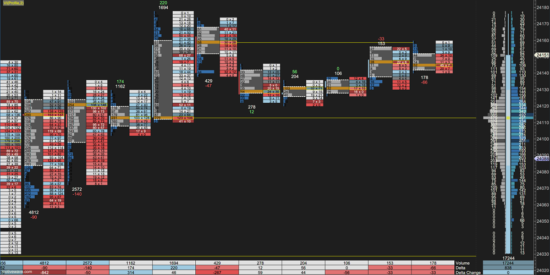
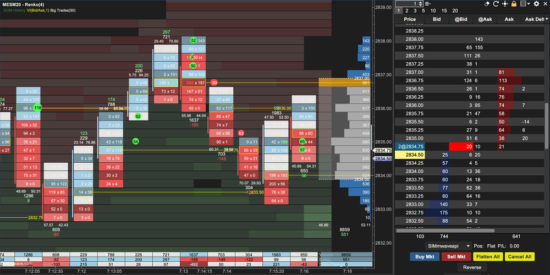
Volume Imprint provides several ways to look at volume and how it relates to price. This study uses historical tick data to segment volume into price intervals. Each price interval divides the volume into bid volume and ask volume. A summary profile can also be displayed that summarizes the volume that occurred over the given time span (visible bars, day, week or month). This summary can be displayed as a volume profile or ladder.
Time Price Opportunity
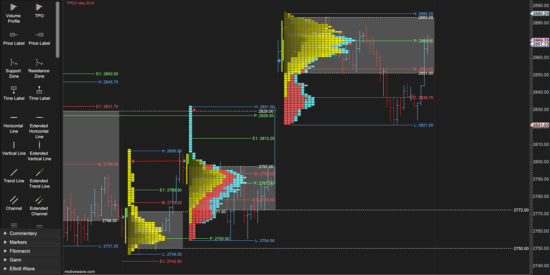
The Time Price Opportunity (TPO) Study displays market activity using time and price (sometimes known as Market Profile). It plots the difference between the Bid/Ask Volume as it accumulates throughout the trading day.
Volume Profile Study & Component
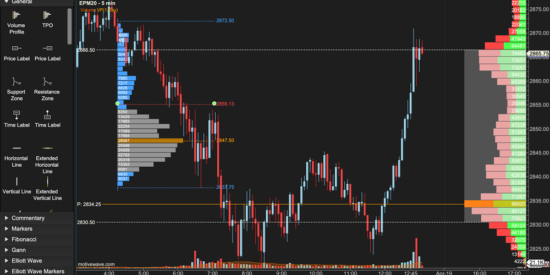
Volume Profile Study displays the distribution of volume traded at each price (or price range) for a given period of time. This identifies how trading activity is distributed by volume (exchanged units) and shows key support and resistance levels.
DOM History Study
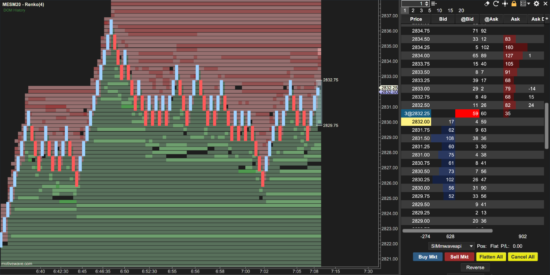
The DOM History Study shows the historical display of cumulative limit order sizes above and below the market price. This study can be very useful to discover where potential support and resistance levels exist based on the cumulative size of the orders to buy or sell at the given price.
Elliott Wave
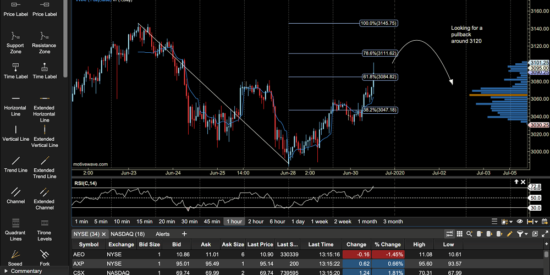
MotiveWave has the most advanced Elliott Wave Software and Elliott Wave Tools available. Elliott Wave Tools range from manual to semi-automatic to automatic Elliott Wave to suit traders’ preference. The Elliott Wave Scanner (pattern recognition tool) allows traders’ to search for specific Elliott Wave Patterns across multiple symbols/instruments based on options you choose.
Time and Sales
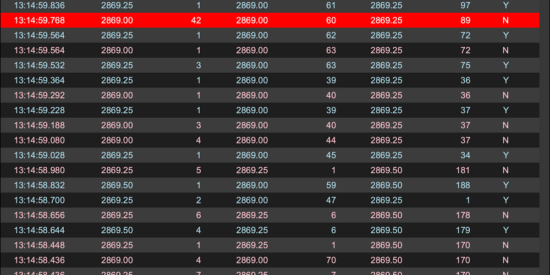
Time & Sales (reading the tape) shows a real-time display of the time and price a trade was filled at, and the size (volume) that each trade includes. This tells traders if there are currently more buyers or sellers, and what prices they are buying and selling at.
VWAP with Standard Deviation and Anchors
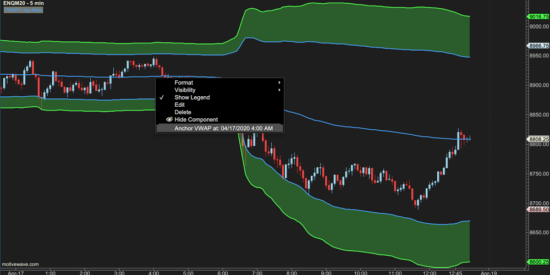
The VWAP (Volume Weighted Average Price) Study uses historical tick data to calculate the average weighted price by volume. Optionally, ticks can be generated from historical minute bars.
With multiple trading platforms and data feed options, traders can access the world of futures trading with competitive intraday margins and low commissions.
